Exploding Bubbles: Visualising Multi-Dimensional Data Using Infragistics Silverlight Controls (Part 4)
In Part 1, I introduced the Exploding Bubbles application.
In Part 2, I focused on the data aspects.
In Part 3, I talked about the visualisation aspects.
In this final port, I discuss docking, theming and cloud-deployment.
Docking
A powerful Dock Manager (samples) is included with the Infragistics Silverlight controls, which enables you to give your users the ability to reconfigure their workspace using panes, tabbed documents etc.
In Exploding Bubbles, you will notice that the Pivot Grid and the Data Chart are in panes that can be hidden, moved around and docked etc.
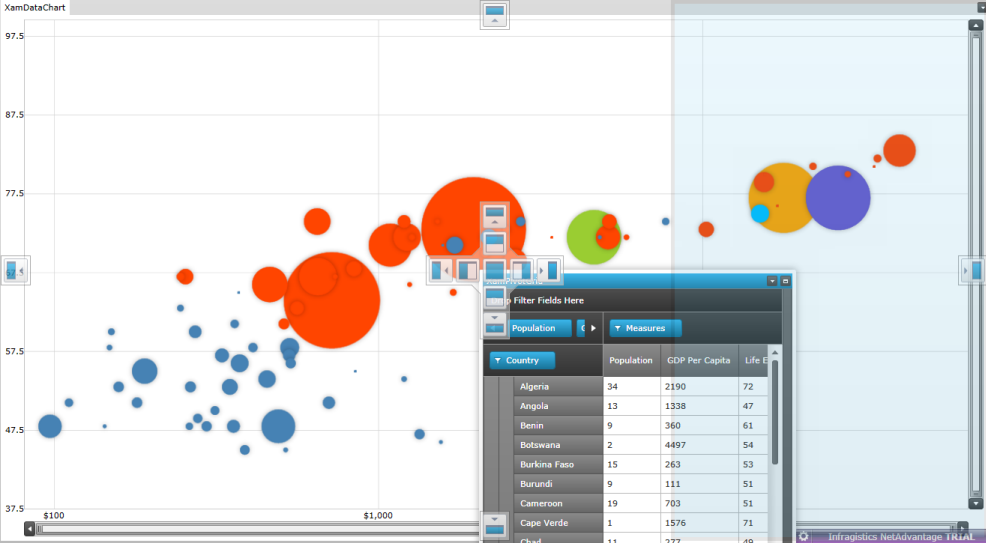
This is achieved by adding a XamDockManager in XAML and hosted the Pivot Grid and Data Chart in ContentPanes:
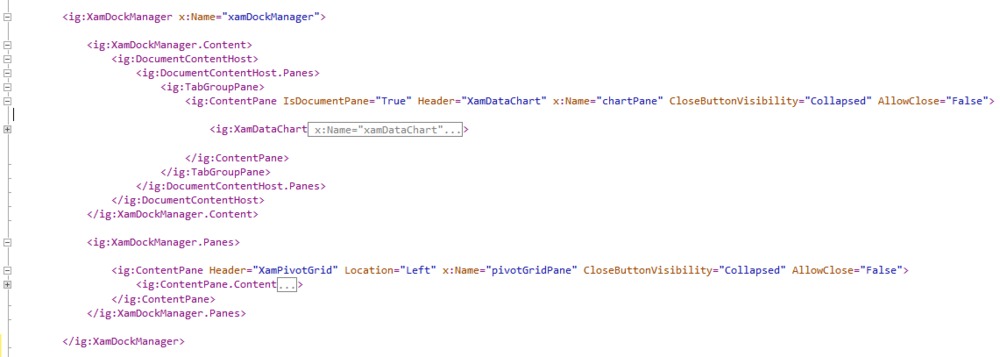
Note that the Data Chart and the Pivot Grid cannot be referred to directly in the code-behind if they are in content panes. Instead they need to be to referred to in the following way:

Styling
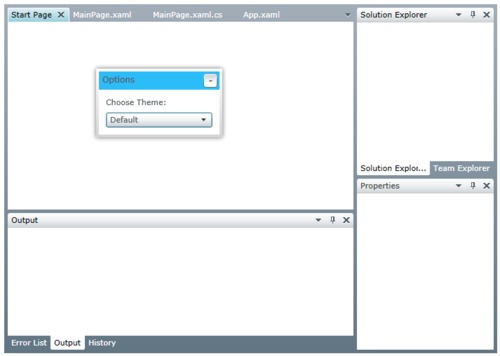
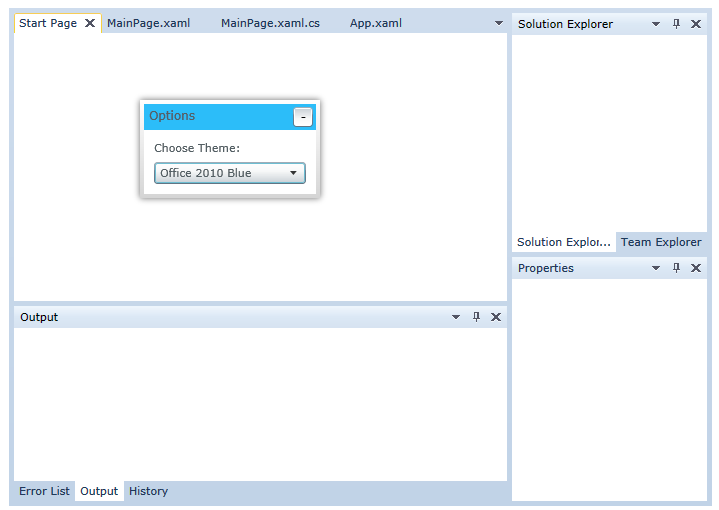
The Infragistics Silverlight controls ship with three styles: IG Theme, Default and Office 2010 Blue. These themes are applicable to all Infragistics Silverlight controls. Click here to can see them in action with the Dock Manager.
Default:
Office 2010 Blue:
IG Theme:
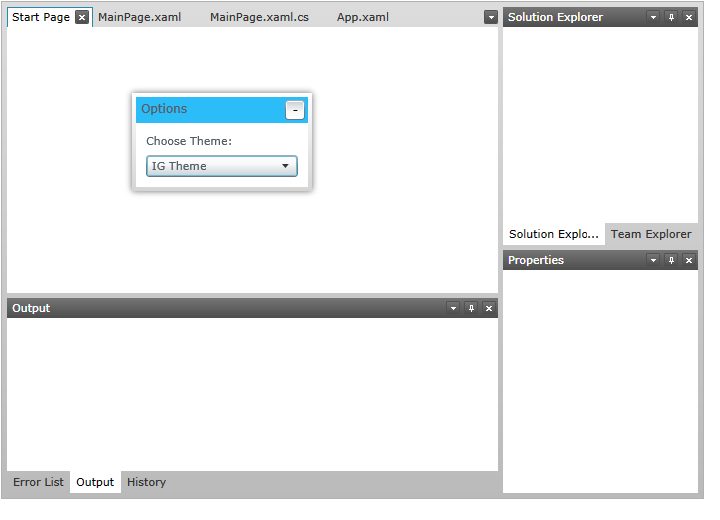
You don’t need to do anything to use the Default theme, but in Exploding Bubbles I have used the IG Theme.
To use a non-default theme, locate the Themes folder in your Infragistics installation e.g. C:\Program Files (x86)\Infragistics\NetAdvantage 2011.1\Silverlight DV\Themes
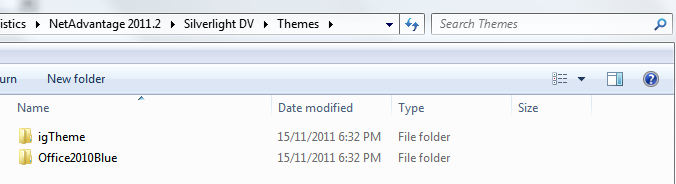
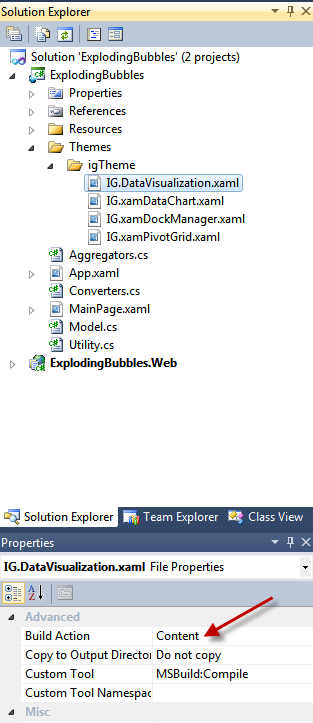
Then create a Themes folder, with a subfolder for the theme and copy the relevant theme files over, making sure that the build action is set to Content.
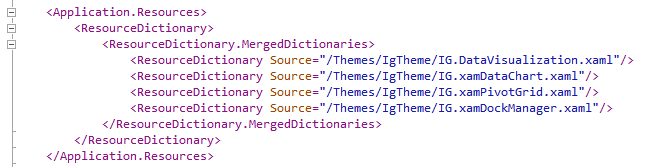
Finally, add them to the merged dictionaries in App.xaml
Deployment
I have deployed the application on the cloud using AppHarbor, a neat new service for hosting applications in the cloud. The advantage of this is that you don’t need to worry about Azure, plus it’s free for one instance!