The Short Version
You can interact with the chart by:
- Left-clicking on bubbles to explode them
- Right-clicking on exploded bubbles to implode them
UPDATE: Exploding Bubbles was made into a showcase application by Infragistics. It was restyled and renamed to Population Explosion. The restyled version can be found here:
The Long Version
In a fascinating video titled Nano-data and Now-Casting: The Analytics Revolution, MIT Sloan Professor Roberto Rigobon says,
“The world has a lot of data, now available [sic]. (But), the world has very little information.”
In a previous post, I touched upon the need for innovative ways to make meaning from the large amount of data that we have access to today and the growing importance of analytics:
“Massive amounts of data – either publicly available, or within enterprises – is a defining feature of computing today, and of growing importance for tomorrow. In fact it’s given rise to a new discipline: data science. As the amount of data grows, traditional methods and tools for making sense of all this data break down and new innovations are necessary.”
One of the ways to understand data is interactive data visualisations. Multidimensional data is especially tricky to visualise because of the complexities of each data point, but if done properly, can provide real insight from the macro- as well as micro-level. A great example of this is the “exploding bubbles” technique, presented by Hans Rosling in a TED Talk from 2006. Look for exploding bubbles starting from around 9m30s into the video.
Inspired by this, I developed the Exploding Bubbles application using Infragistics Silverlight and Silverlight Data Visualization controls.
Here is a video of Exploding Bubbles in action:
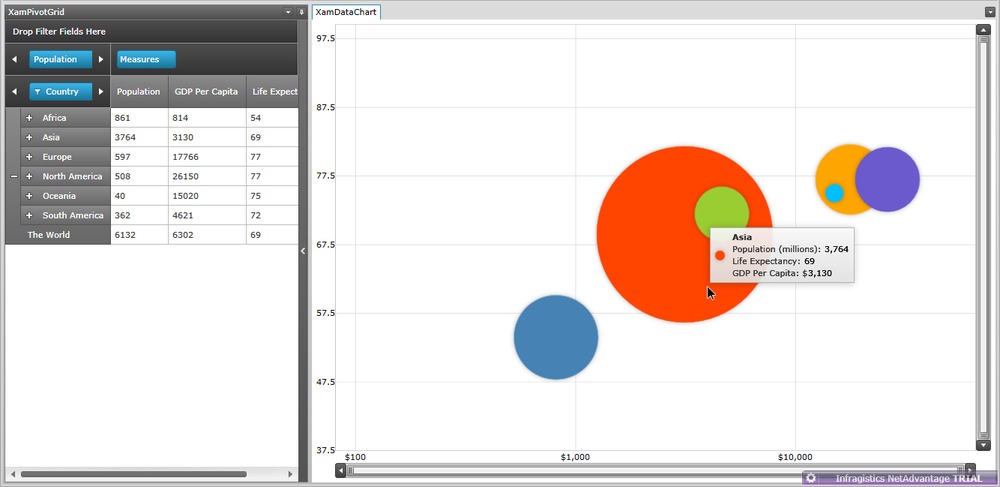
This is what the application looks like when you first run it:

On the left you will notice a pivot grid showing multidimensional data. On the right is a bubble chart, a visualisation of that data.
The pivot grid shows global “health and wealth” statistics. The data is plotted on the chart in the following way:
- Population is depicted by bubble size
- GDP Per Capita is depicted on the X-axis on a logarithmic scale
- Life Expectancy is depicted on the Y-axis on a linear scale
You can interact with the chart by:
- Left-clicking on bubbles to explode them
- Right-clicking on exploded bubbles to implode them
You can also interact with pivot grid by expanding or collapsing rows – the bubble chart is synchronised with the pivot grid’s data.

You can download the source code from here: http://dl.dropbox.com/u/15104486/ExplodingBubbles.zip
Have fun!
In following posts, I will talk about the implementation details and cover aspects of the following Infragistics controls/features:
- Pivot Grid
- Data Chart
- Excel
- Dock Manager
- Motion Framework
- Theming
In the meantime, for more details of what you can achieve using these and other Silverlight controls from Infragistics, you can browse through the samples and read the documentation.
Read the rest of the posts in the series: